
What is Mobile Analytics?
Mobile analytics means tracking how people use your App. It helps you collect user behavior data, understand user intent, and take action to boost retention, engagement, and conversion.
This field also encompasses the mobile web, but primarily focuses on native iOS and native Android applications.
In the past, companies used Excel and SQL for reports. Today, modern analytics tools have replaced that. These tools follow analytics best practices and save hours of work.
Both consumer applications and business applications face similar challenges—low app retention and ineffective mobile marketing. That’s why app analytics is so essential for growth.
Why Use App Analytics?

Analytics highlights app performance, user likes, pain points, and areas to improve.
In app development, especially mobile app development, this feedback is extremely valuable. It helps you build better products and deliver more value.
Here are four significant benefits of using mobile analytics.
1. Collect Accurate User Data
App analytics gives you real-time data about your users. You can see:
- Which App features do people love?
- Which App functionalities cause problems?
- Where users leave the App.
This accurate user data guides your app improvements. You can plan smarter app upgrades, identify weak points, and implement changes that enhance the user experience.
2. Track Business Goals
Analytics connects your App to your business goals. It shows you which acquisition channels bring the best users with the highest customer lifetime value (LTV).
This helps you focus on quality over quantity. It shows which channels bring results and which don’t.
For companies in mobile app development, this means every dollar spent supports growth.
3. Increase User Engagement and Retention
With mobile app analytics, you can easily follow every step of the user journey. Reports show how people interact with your App, which content they enjoy, and when they stop using it.
With this knowledge, you can:
- Improve user flow.
- Add features that drive user engagement.
- Strengthen app retention with a smoother experience.
Better engagement leads to loyal users—and more conversions.
4. Deliver Personalized, Customer-Focused Marketing
People expect apps to feel personal. App analytics helps you deliver that.
Studying user profiles and behavior helps you create campaigns that truly connect. Send each user content made just for them, not the same for everyone.
This type of customer-focused marketing improves the customer experience. It also makes it easy to set up strong re-engagement strategies so users keep coming back.
Types of App Analytics Tools
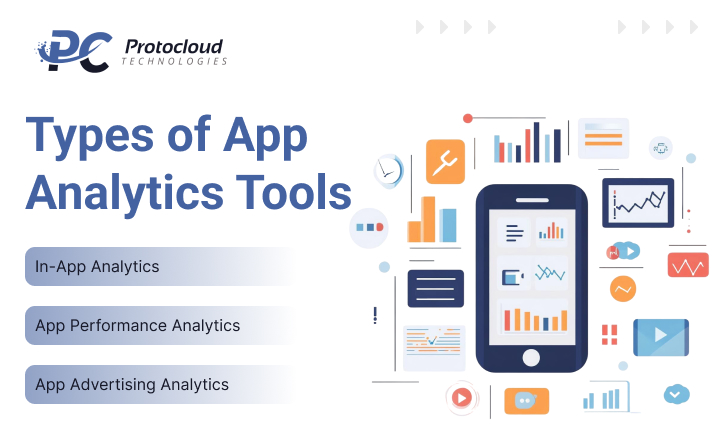
App analytics tools come in different types, each helping you track and improve a specific part of your app. Each one tracks different metrics.
When you understand different app analytics tools, it’s easier to pick the best for app development and mobile app development.
In-App Analytics
- In-app analytics show how people use your App.
- You can see every tap, swipe, and screen view.
- It measures user engagement to show what users enjoy most.
- It also provides details such as user demographics and device information.
- These insights help you improve your App and create better mobile app development strategies.
App Performance Analytics
- App performance analytics tools are part of the in-app category, but with a different focus.
- Instead of tracking users, they track how the App itself performs.
- They run app audits to find errors or slowdowns.
- Metrics include uptime, responsiveness, resource utilization, and crashes across various devices.
- Resolving these issues enhances application performance and ensures user satisfaction.
- For long-term app development success, performance comes first.
App Advertising Analytics
- App advertising analytics tools power your marketing campaign.
- They track your App’s results across marketing channels.
- Metrics include ad clicks and in-app behaviors following ad exposure.
- Know what’s working for sales, online and offline.
- These tools show returns on advertising spending.
- With the data, you can target the right audience and manage marketing spend wisely.
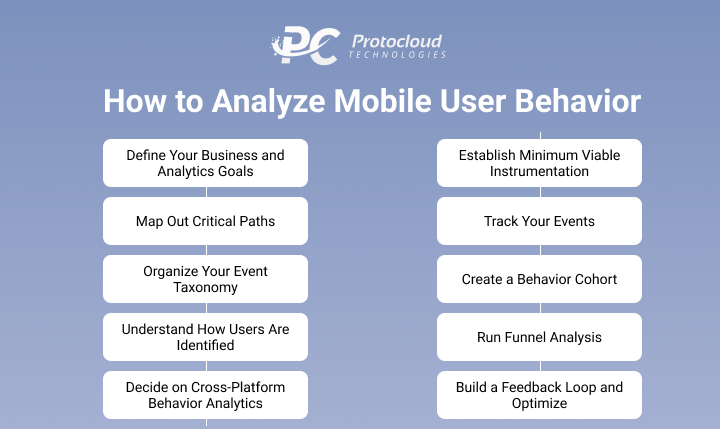
How to Analyze Mobile User Behavior
Understanding mobile user behavior is key to achieving better engagement, higher retention, a more substantial lifetime value, improved conversion rates, and faster revenue growth.
When you clearly know what users do inside your App, you can optimize the experience. This will result in smoother onboarding, increase in customer retention, and increase in sales. In simple words, better insights lead to better results for your mobile app development success.
So, how do you begin doing user behavior analysis?
Here are 10 simple steps to do it the right way:
Step 1: Define Your Business and Analytics Goals
Start by setting clear business and analytics goals.
Start with this question: What is the primary goal of your app? What is your team working towards?
Once you know your primary business goal, break it down into Key Performance Indicators (KPIs)—the numbers that track progress.
Example: A revenue-focused goal may link to KPIs such as:
- Boosting onboarding conversions
- Improving customer retention
- Increasing checkout funnel conversions
Define these goals before building your event taxonomy. This ensures you send the correct data to the right project and measure KPIs accurately.
Step 2: Map Out Critical Paths
Critical paths are the key actions users take that directly connect to your App’s purpose.
● For an e-commerce app:
Flow: Search → Browse → Add → Checkout → Confirm
● For a gaming app:
Open App → Register → Verify Account → Complete Tutorial
These paths illustrate how people progress from the conversion entry point. When you understand them, you can enhance onboarding and improve overall app performance.
Step 3: Organize Your Event Taxonomy
With event taxonomy, tracking user actions becomes simple by organizing events and properties. It’s like a roadmap for your app analytics.
If you’re using product analytics platforms (like Amplitude), you can manage your taxonomy directly. Otherwise, you may use spreadsheets to log events, event properties, and user details.
Step 4: Understand How Users Are Identified
Next, figure out how your analytics platform identifies users.
Most platforms use identifiers like usernames, emails, or user IDs through mobile SDKs or APIs. This way, data from multiple devices and sessions connects to a single person.
It’s vital that this identification is stable and doesn’t change.
For example, Amplitude uses a unique amplitude_ID to ensure all events are connected to the correct user, thereby avoiding confusion when anonymous devices log activity.
Step 5: Decide on Cross-Platform Behavior Analytics
If your App is available across platforms (mobile, web, in-store POS), decide whether to track them separately or together.
- Track separately → If behavior differs across platforms
- Monitor together → Monitor all actions to get the full picture of your customer’s journey
Example: Instacart uses cross-platform tracking to track how users shop on mobile and web platforms.
This step is especially valuable in app development projects that involve multiple platforms.
Step 6: Establish Minimum Viable Instrumentation
Once your goals, paths, and taxonomy are ready, set up minimum viable instrumentation.
This means:
- Integrating your mobile SDK or API
- Assigning user IDs
- Collecting basic app performance metrics
Start small with essential tracking—don’t overcomplicate it. You can always add more later as your app development grows.
Step 7: Track Your Events
Now, start tracking events. Focus only on the most essential actions linked to your critical paths (Step 2). Don’t try to track everything.
For example:
- Onboarding events
- Conversion events
- Retention events
This way, you get clear insights without overwhelming your analytics setup.
Step 8: Create a Behavior Cohort
A behavior cohort is a group of users who perform (or don’t perform) specific actions within your App.
Example:
- Users who finish onboarding in under 5 minutes
- Users who abandoned checkout at the payment page
By segmenting users in this way, you can identify patterns, compare groups, and test which improvements yield the best results.
Behavior cohorts help you:
- Understand which users are most valuable
- Identify where people drop off
- Personalize your marketing and product updates
This step is beneficial in mobile app development because it shows you exactly which features engage or frustrate your audience.
Step 9: Run Funnel Analysis
Funnel analysis helps you understand how users move through each stage of your App’s critical path.
For example, in an e-commerce app:
1.Open App
2.Search Product
3.Add to Cart
4.Checkout
5.Complete Purchase
By tracking these steps, you can see:
- Where users drop off
- How many users make it to conversion
- Which stages need optimization
This analysis provides a clear roadmap for enhancing conversions in your app development strategy.
Step 10: Build a Feedback Loop and Optimize
The final step is to build a feedback loop that turns data into informed decisions.
Here’s how:
1.Analyze the data from your cohorts and funnels
2.Identify weak points or opportunities
3.Test new updates or features
4.Measure the results
5.Repeat the process
This cycle ensures your App continuously improves and stays aligned with user needs.
A strong feedback loop is the backbone of mobile app development because it keeps your product relevant, user-friendly, and competitive in the market.
Avoiding Common Analytics Mistakes
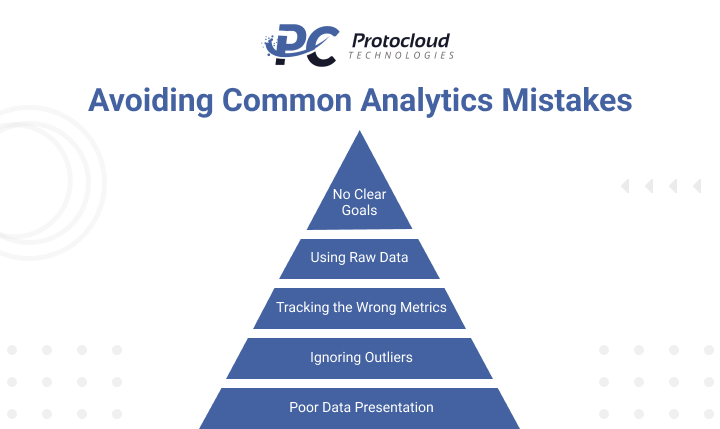
1. No Clear Goals
Without clear goals, data feels confusing. Set measurable goals that match your business strategy. In app and mobile app development, it enables you to direct your attention to the right outcomes.
2. Using Raw Data
Raw data is riddled with errors and can mislead you. Make sure your data is clean and well-formatted before you use it. In mobile app development, clean data shows real user behaviour.
3. Tracking the Wrong Metrics
Not all metrics matter. Focus on the ones that affect growth, like CLV or MRR, instead of vanity numbers. This is key to app development success.
4. Ignoring Outliers
Outliers are unusual results. They may show hidden opportunities or risks. In mobile app development, they can reveal bugs or unique user needs.
5. Poor Data Presentation
Data should be easy to understand. Use clear charts, graphs, and visuals. In app development, good visualisation helps teams make faster and smarter decisions.
What is Mobile App Retention?
Mobile app retention represents a concept and a metric at the same time. This helps you understand how effective your onboarding process is and gives insight into the overall user experience (UX design).
A high mobile app retention rate means strong engagement, successful app development, and satisfied users. Simply put, if people keep coming back, your mobile app development process worked well.
To determine how well your App retains users, you need to calculate the retention rate for a specific period (e.g., day, week, month, or quarter).
How to Calculate Mobile App Retention Rate
You only need three key pieces of data:
1.Users at the start of the given period.
2.Users at the end of the given period.
3.Users gained during the period.
The first two are straightforward. But why do we need to count new users? Because new users are not yet considered retained. They weren’t active at the start of the period. Since they appear in the end total, they must be removed for accuracy.
This is where the retention rate formula comes in.
The Retention Rate Formula
Here’s the simple calculation:
Retention Rate=Users at Start(Users at End–Users Gained)×100%
This formula ensures your app retention calculation is precise. It shows how well your app performance metric aligns with actual user retention.
Why Is It Important to Track Mobile App User Retention?
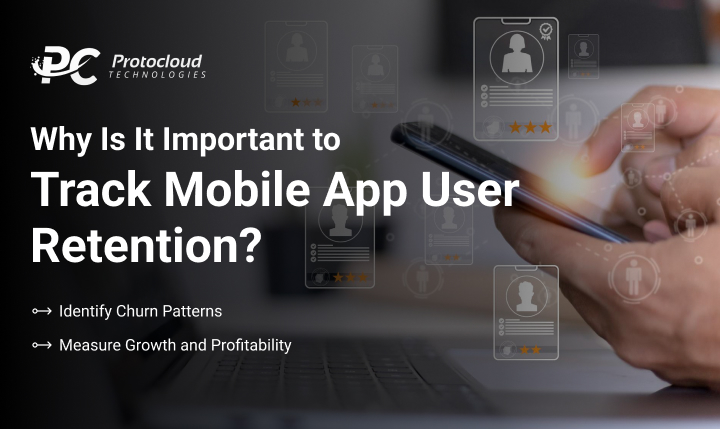
Tracking mobile app user retention is one of the smartest moves in app development. Retention measures the frequency at which users return after their initial visit. It’s more than just numbers—it’s about user loyalty and user satisfaction.
A low retention rate signals a problem. It means users are not finding enough value in your mobile app development work. They leave for alternatives. On the other hand, a high retention rate indicates that your App delivers real value and fosters user engagement.
Identify Churn Patterns
One of the biggest reasons to track retention is to spot churn patterns early. User churn tells you when and why users leave.
By monitoring churn, product managers and product data analysts can refine onboarding, improve app stickiness, and increase user engagement. This data helps you adjust features, messaging, or support before the problem grows.
A high churn rate usually signals poor user satisfaction or weak engagement. Reducing churn is the first step toward building a stronger user base and improving your App’s success.
Measure Growth and Profitability
Tracking mobile app retention metrics isn’t just about loyalty; it’s also about understanding user behavior and preferences. It also highlights app growth and profitability.
To measure performance, look at the number of active users. They tell you how many users keep coming back to your App. You can measure them with two key metrics:
●Daily Active Users (DAU): People who open and use your App every day.
●Monthly Active Users (MAU): The count of people using your App in a month.
It reflects your App’s stickiness—how often users return.A healthy DAU/MAU ratio (10–20%) shows users truly value your app. Only a few apps reach more than 50%, but those that do usually dominate their market.
This insight is crucial for mobile app performance.It shows how much users depend on your product. It provides a clear picture of how well your app development efforts are paying off.
Top Mobile App Retention Metrics to Track
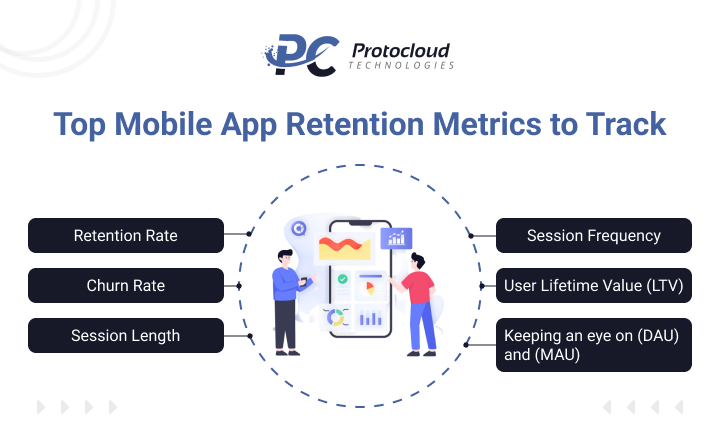
If you’re a product data analyst or product manager, you need to master app retention metrics. They guide your decisions, sharpen strategies, and help your app succeed.
These are the main retention metrics to track:
1. Retention Rate
The retention rate is the percentage of users who return to your App after their first visit.
Formula:
Retention Rate = ((Users at End – Users Gained) ÷ Users at Start) x 100%
High retention means your app delivers real value. It indicates that users want to return, which is the ultimate sign of user satisfaction.
2. Churn Rate
The churn rate is the opposite of retention. Monitors how many users discontinue using your app over a specified time period.
Formula:
Churn Rate = (Users Lost ÷ Users at Start) x 100%
High user churn is a warning. It indicates your mobile app development strategy requires some tweaking. Reducing churn matters as much as growing retention.
3. Session Length
Session length shows how long users spend in your app each visit. Longer sessions often mean higher engagement.
But don’t just aim for long sessions. Focus on making the time meaningful. Users should feel they’re gaining value every time they open your App.
4. Session Frequency
Session Frequency measures how often users return to your App within a specific timeframe. If users return to the App several times a day or a week, it’s a strong indicator of app stickiness.
Frequent use means your app has become part of users’ daily lives. That’s precisely what every mobile app development project should aim for.
5. User Lifetime Value (LTV)
LTV is the total revenue you expect from one user over their lifetime. It’s a powerful metric because it connects user retention with profitability.
If retention is low, your App’s Lifetime Value (LTV) will also decline. A higher
LTV allows you to invest more in marketing, customer service, and app development without compromising your bottom line.
6. Keeping an eye on Daily Active Users (DAU) and Monthly Active Users (MAU)
We touched on this earlier, but DAU and MAU deserve a closer look. These metrics provide a snapshot of your App’s health and growth.
- DAU highlights immediate engagement.
- MAU reflects long-term usage.
Together, they demonstrate how well your App strikes a balance between short-term excitement and long-term loyalty.
Conclusion
Mobile app analytics helps you turn app activity into clear insights. Track how users act, monitor app performance, and measure marketing results. This makes the whole user journey better.
An app analytics tool works like a web analytics tool, but it’s made just for apps. It helps you get more acquisitions, create personalised marketing, and improve the user experience. That means stronger retention, higher engagement, and more ROI.
Before you pick a tool, check the pricing structure, features, metrics, and support. Choose one that matches your business goals. This way, you boost revenue and deliver a better UX.


Leave a Reply